
Sales forecast accuracy is how closely your predicted revenue matches what you actually close, and most B2B teams land within 8% to 15% of their number each quarter. If you're inside that range, you're average to good. Above ±15% means the process needs work; hitting ±5% consistently puts you in elite territory. If you're outside that range, the fix isn't a new tool. It's a 60-day pilot on data hygiene and forecast cadence.
TL;DR:
- Most teams achieve sales forecast accuracy within 8% to 15%, with elite performance at ±5%, requiring a 60-day focus on data hygiene and forecast cadence.
- Accurate measurement depends on the aggregation level and horizon, with different formulas like MAPE and WAPE suited for deal size diversity across datasets.
- Improvements come from fixing incomplete data, establishing a formal commit gate, running regular reviews, and calibrating forecasts against historical trends.
- Leadership should focus on building disciplined operating rhythms and measuring bias and coverage ratio, not just accuracy numbers, to sustain reliable forecasts.
- External support, such as consulting or audits, can accelerate progress by fixing data issues, defining stage processes, and embedding review habits into team routines.
Table of Contents
- What Does Sales Forecast Accuracy Actually Measure?
- How Do You Calculate Forecast Accuracy?
- What Is a Good Forecast Accuracy Benchmark?
- What Causes Sales Forecasts to Miss?
- How Do You Improve Sales Forecast Accuracy?
- How Do You Build an Operating Rhythm Around Forecast Accuracy?
- How TKD Consulting Approaches Forecast Accuracy Problems
- Why Forecast Accuracy Is a Leadership Discipline, Not a Reporting Problem
- Get Hands-On Help Fixing Your Forecast Process
- Sources
- FAQ
What Does Sales Forecast Accuracy Actually Measure?
Accuracy, error, and bias are three different questions, and mixing them up is the fastest way to misread your own numbers. Accuracy asks how close you got. Error asks by how much you missed, in either direction. Bias asks whether you tend to miss the same way every time, which is the tell for rep optimism or sandbagging.
Grain and horizon change the answer just as much as the formula. A forecast measured at the deal level looks different from one rolled up by rep, product line, or region, and a number pulled at "commit" three weeks before quarter-close behaves nothing like the same number measured on day one of the quarter. Reporting "we're at 82% accuracy" without saying whether that's monthly, by product family, or at the deal level is close to meaningless. The aggregation level and the horizon you choose determine whether the metric tells you anything you can act on.
How Do You Calculate Forecast Accuracy?
The simplest formula is accuracy percentage: 1 minus the absolute value of (actual minus forecast) divided by forecast, expressed as a percentage. Forecast error is just the inverse: (actual minus forecast) divided by forecast. Both work fine for a single number, but they fall apart once you're averaging across many deals or reps.
That's where MAPE (Mean Absolute Percentage Error), WAPE or WMAPE (Weighted Absolute Percentage Error), and MAE (Mean Absolute Error) come in:
- MAPE averages the percentage error across every forecast in the set, treating a $2,000 miss on a $5,000 deal the same as a $200,000 miss on a $500,000 deal.
- WAPE/WMAPE weights each error by its actual size, so a big miss on a big deal counts more than a big miss on a small one.
- MAE reports the average dollar or unit miss with no percentage math at all, which is useful when percentages get distorted.
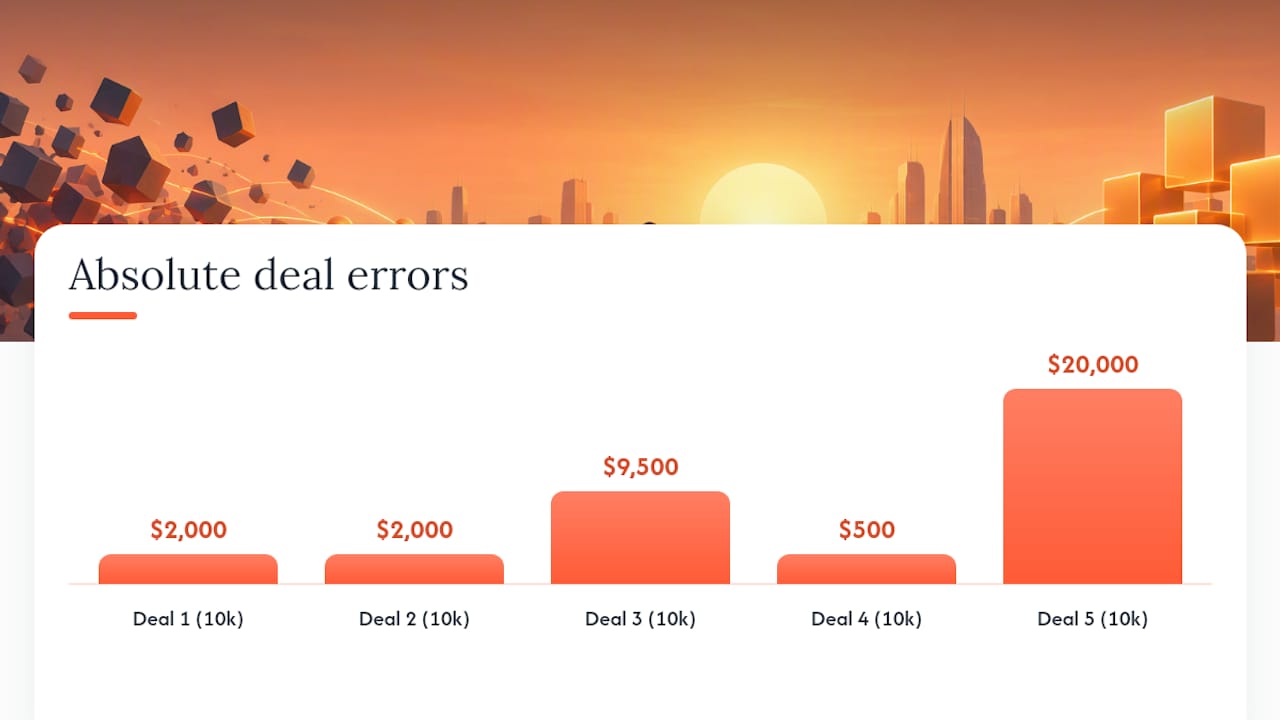
Say you forecast five deals at $10,000 each and the actual results come in at $8,000, $12,000, $500, $9,500, and $30,000. MAPE will blow up because that $500 deal produces a 95% error rate that skews the average, even though it's a rounding error in dollar terms. WAPE fixes that by weighting on volume instead of treating every deal equally, which is why it's the preferred metric when actuals include a lot of small or zero values.
What Is a Good Forecast Accuracy Benchmark?
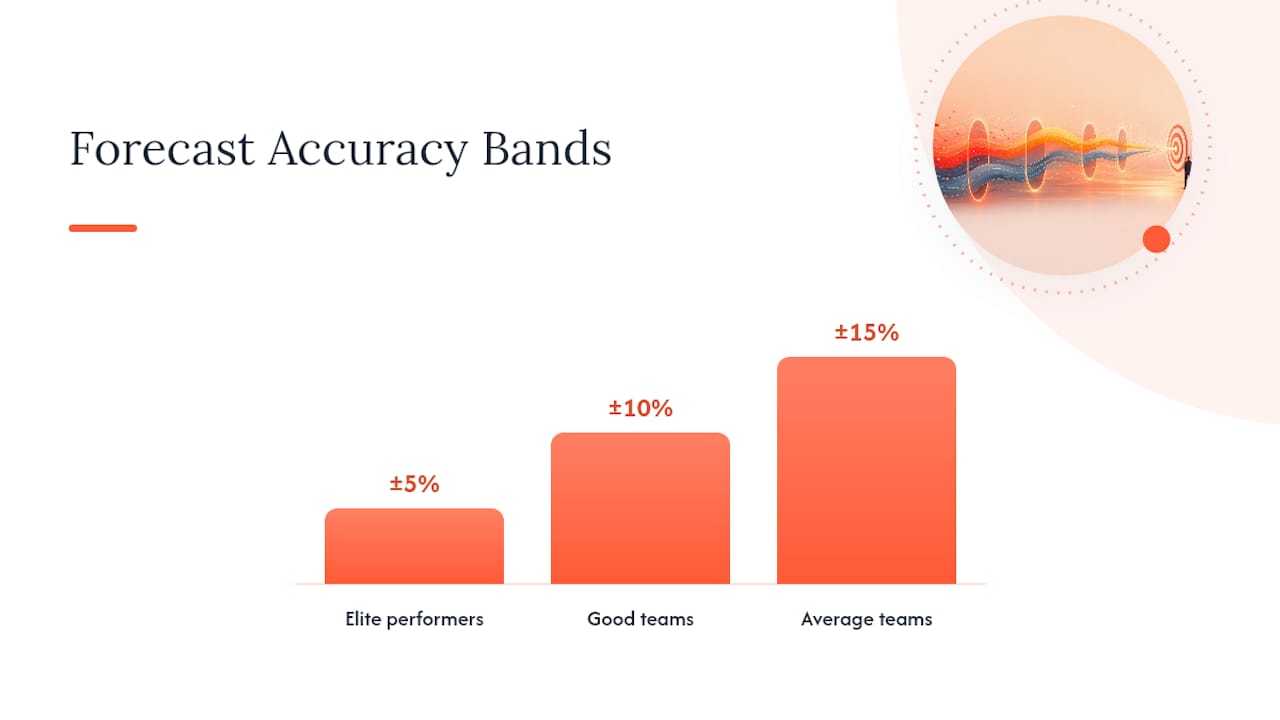
Three tiers cover most B2B organizations: elite performers hit ±5%, good teams run ±10%, and the average lands around ±15%. These aren't arbitrary. They come from benchmarking across many B2B industries, and the pattern holds regardless of company size once you control for deal complexity.
The caveat: one good quarter doesn't mean your process works. A team that nails Q2 and misses Q3 by 20% doesn't have an accuracy problem so much as a consistency problem, and consistency is the harder thing to fix. Look at rolling accuracy over four to six quarters before you draw any conclusion about whether you're systemically broken or just had a bad stretch.
Stage definitions don't mean the same thing across teams, or your CRM data has never been reliable enough to trust.
What Causes Sales Forecasts to Miss?
Most inaccuracy traces back to a small set of repeat offenders, and none of them require a new algorithm to fix. Many B2B organizations only see 60% to 70% of CRM fields consistently populated, which means your model, however good, is working with holes in the data.
- Incomplete data. Missing close dates, stale next-steps fields, and unlogged competitor activity all quietly corrupt the forecast before anyone runs a formula.
- Rep optimism bias. Reps consistently round deals up, call things "committed" that haven't cleared procurement, and rarely admit a deal has stalled.
- Inconsistent stage definitions. If "Stage 3" means something different on two different teams, your rollup number is an average of two incompatible datasets.
- Fragmented systems. When pipeline data lives in the CRM, deal notes live in email, and forecast rollups live in a spreadsheet, nobody has one version of the truth.
- Market volatility. Even a clean process can miss when buying committees shrink budgets mid-cycle, which no amount of internal discipline fully controls.
How Do You Improve Sales Forecast Accuracy?
Fixing this is a sequence, not a single project. Start with the data, then tighten the gate, then build the review habit, then calibrate against history, and only then consider machine learning.
- Clean the data first. Define required fields (close date, next step, economic buyer, competitive status), automate validation checks, and assign a named owner for each pipeline segment. Initial cleanup alone typically produces a 10% to 20% accuracy improvement.
- Build a commit gate. A deal doesn't enter the commit forecast without documented budget proof, a confirmed timeline, legal or procurement engagement, and a named decision-maker.
- Run a weekly inspection cadence. A standing commit call plus a monthly variance review, comparing forecast to actual, catches drift before it compounds.
- Calibrate against history. Use historical conversion rates by stage and WMAPE by segment rather than a flat percentage applied to every deal.
- Add machine learning only when the prerequisites are met. Deal-level ML can lift accuracy from the 60% to 75% range typical of stage-based forecasting up to 75% to 90%, but only with clean data and real engagement signals feeding it. Without continuous retraining as deals close, model accuracy degrades quickly in a shifting market.
Pro Tip: Run your commit gate as a checklist, not a conversation. The moment a rep has to argue for an exception, you've found the deal that's about to blow up your quarter.
How Do You Build an Operating Rhythm Around Forecast Accuracy?
A cadence without owners is just a meeting. Weekly commit calls should belong to frontline managers, monthly variance reviews to RevOps, and quarterly retrospectives to sales leadership, with each layer feeding the one above it.
- Weekly: frontline managers inspect commit deals against the qualification checklist.
- Monthly: RevOps runs the variance review, comparing forecast to closed revenue by segment.
- Quarterly: leadership reviews the rolling trend and decides whether tactical or structural changes are needed.
Track more than the accuracy number itself. Bias (are misses systematically high or low?), coverage ratio (how many deals actually clear the commit gate?), and the percentage of commit deals with documented proof all tell you whether the process is holding, not just whether last quarter landed close. A disciplined rhythm like this is what separates elite forecasters from teams that get lucky some quarters and blindsided in others.
A useful 60-day pilot runs in three stretches: days 1 to 20 fix data hygiene and stand up the commit gate, days 21 to 45 run the weekly inspection cadence and start tracking bias, and days 46 to 60 compare rolling accuracy against your pre-pilot baseline. Judge success by whether the trend line moved, not by one clean week.
How TKD Consulting Approaches Forecast Accuracy Problems
An Operations Audit treats forecast accuracy as a people, process, and systems problem, not a spreadsheet problem. The diagnostic maps where field population breaks down, where stage definitions drift between reps, and where the commit gate has quietly gone soft.
The typical 60-day priority list mirrors the playbook above: fix the data fields that matter, install a real commit gate, run weekly inspection calls, and coach managers on how to run a variance review instead of just reading numbers off a screen. The goal is a scorecard and cadence the team still runs on day 90, not a deck that gets filed away after the engagement ends.
Why Forecast Accuracy Is a Leadership Discipline, Not a Reporting Problem
Boards and finance teams care about accuracy for one reason: it's the clearest proxy for whether leadership actually understands its own pipeline. A CFO who can't trust the forecast starts hedging every resource decision, and that hedge shows up as slower hiring and conservative budgets across the business.
Changing that culture starts with what you measure and reward. If reps get credit for optimistic pipeline instead of accurate pipeline, you'll keep getting optimism. Start measuring bias openly, and reward the manager whose forecast holds, not the one whose pipeline looks biggest. A 60-day pilot is enough time to find out which one you actually have.
— David
Get Hands-On Help Fixing Your Forecast Process
Reading the playbook is one thing. Running the commit gate through a real quarter with a team that's used to rounding numbers up is another. TKD Consulting's 90-Day Operations Audit is built for exactly that gap: a fixed-price, time-boxed diagnostic that maps your data hygiene, stage definitions, and inspection cadence against what your forecast actually needs, then hands your team a prioritized 60-day plan they can run without hiring another executive.
If pipeline qualification and rep discipline are the bigger issue, TKD's Sales Consulting engagement focuses specifically on qualification gates, conversion-rate calibration, and manager coaching, the parts of the forecast problem that tools alone don't fix. Every recommendation is written to hand to a sales manager on Monday morning, with the scorecards and meeting templates that keep it from fading after the engagement ends. Book a discovery call to find out which starting point fits your pipeline.
Sources
FAQ
How Do You Calculate the Accuracy of a Sales Forecast?
The basic formula is 1 minus the absolute value of (actual minus forecast) divided by forecast, expressed as a percentage. For aggregated data across many deals or reps, use WAPE or WMAPE instead of a simple average, since it weights errors by deal size rather than treating a $500 miss the same as a much larger one.
What Is a Good Forecast Accuracy Level?
Elite teams hit ±5%, good teams run around ±10%, and the average across many B2B industries sits near ±15%. Judge yourself on a rolling four to six quarter average rather than a single quarter, since one good or bad quarter doesn't reveal whether your process actually works.
What Is the Golden Rule of Forecasting?
There isn't one universal "golden rule," but the closest thing to it in practice is that a forecast is only as reliable as the data and discipline behind it. No formula fixes a pipeline built on missing fields and optimistic rounding, which is why hygiene and a weekly inspection cadence come before any metric refinement.
Should I Use MAPE or WAPE for Sales Forecasting?
Use WAPE or WMAPE when your pipeline includes a mix of very large and very small deals, since MAPE gets distorted by small denominators and can make a minor miss look catastrophic. MAPE still works fine for a set of deals that are roughly similar in size.
How Much Does It Cost to Get Help Improving Forecast Accuracy?
TKD Consulting's 90-Day Operations Audit is a fixed one-off price of 3500 USD. For a deeper pipeline and qualification rebuild, Sales Consulting engagements run from 15000 to 50000 USD depending on scope.