
An operations scorecard is a one-page tool that translates strategy into weekly operational action by surfacing the leading indicators tied to your current binding constraint. Start this week: pick the one constraint limiting your results, map 6–18 KPIs to it (3–5 per domain), and schedule your first weekly review.
Three actions before Friday:
- Identify the single operational constraint costing you the most margin or throughput right now
- Select 6–18 candidate KPIs (3–5 per domain) that directly predict whether that constraint is improving
- Block 30 minutes on the calendar for a weekly review with the people who own those numbers
The balanced scorecard framework, developed by Robert Kaplan and David Norton in the early 1990s, established the four-domain structure most scorecards still use. TKD Consulting's Operations Audit builds directly on that lineage, adding the execution layer most implementations skip.
Table of Contents
- What makes an operations scorecard different from a financial report?
- How many KPIs should your scorecard have, and which ones?
- How do you design a one-page operations scorecard?
- What does good scorecard governance actually look like?
- Two ready-to-use scorecard templates with mock values
- What typically breaks scorecards, and how do you prevent it?
- A practical 60-day rollout plan for owner-operators
- Key Takeaways
- Why the one-page constraint matters more than the framework
- TKD Consulting's Operations Audit builds your scorecard for you
- Useful sources and further reading
What makes an operations scorecard different from a financial report?
Financial reports explain the past. An operations scorecard predicts what happens next and gives you time to intervene. That distinction is the whole point.
Kaplan and Norton's original insight, published in HBR in 1992, was that financial measures alone create an accountability gap: by the time the numbers arrive, the window to act has closed. A well-designed business scorecard pairs lagging outcomes with leading indicators so leadership sees problems forming, not just problems that already happened.
The scorecard also governs behavior more directly than a performance review does. Metric design is a leadership decision, not an HR exercise.
Who uses it and why:
- CEO/Owner: weekly read on whether the business is executing against the quarter's constraint
- VP/Director of Operations: owns the review cadence and escalation decisions
- Frontline supervisor: updates the numbers and flags anomalies before the weekly meeting
- Finance/business partner: validates data integrity and connects operational trends to P&L impact
Pro Tip: Track only metrics a manager can actually influence within the review cadence you've chosen. A metric no one can move in a week belongs on the monthly dashboard, not the weekly scorecard.
How many KPIs should your scorecard have, and which ones?
Use four domains and 6–18 total KPIs, with 3–5 per domain. Smaller teams or constraint-focused quarters should target the lower end (6–8); cross-functional steady-state operations can carry up to 18 without losing focus.

The anchor metric in the internal process domain should be SLA attainment. Throughput is a supporting metric and can mislead if quality is poor. Pair every lagging outcome (gross margin, customer churn) with at least one leading indicator (weekly throughput, pipeline conversion rate) so you can intervene before month-end results land.
| Domain | Industrial | B2B Services | SaaS |
|---|---|---|---|
| Financial | Gross margin %, cost per unit | Revenue per billable hour, AR aging | MRR growth, gross margin % |
| Customer | On-time delivery rate, defect rate | SLA attainment, NPS | NRR, churn rate |
| Internal Process | Throughput rate, cycle time | Utilization rate, backlog aging | Deployment frequency, incident MTTR |
| Learning/Growth | Cross-training completion %, safety incidents | Certification rate, process improvement count | Feature adoption rate, employee NPS |
For revenue operations metrics, marketing KPI selection follows the same constraint-mapping logic: pick the metrics that predict the outcome, not the ones easiest to collect.
How do you design a one-page operations scorecard?
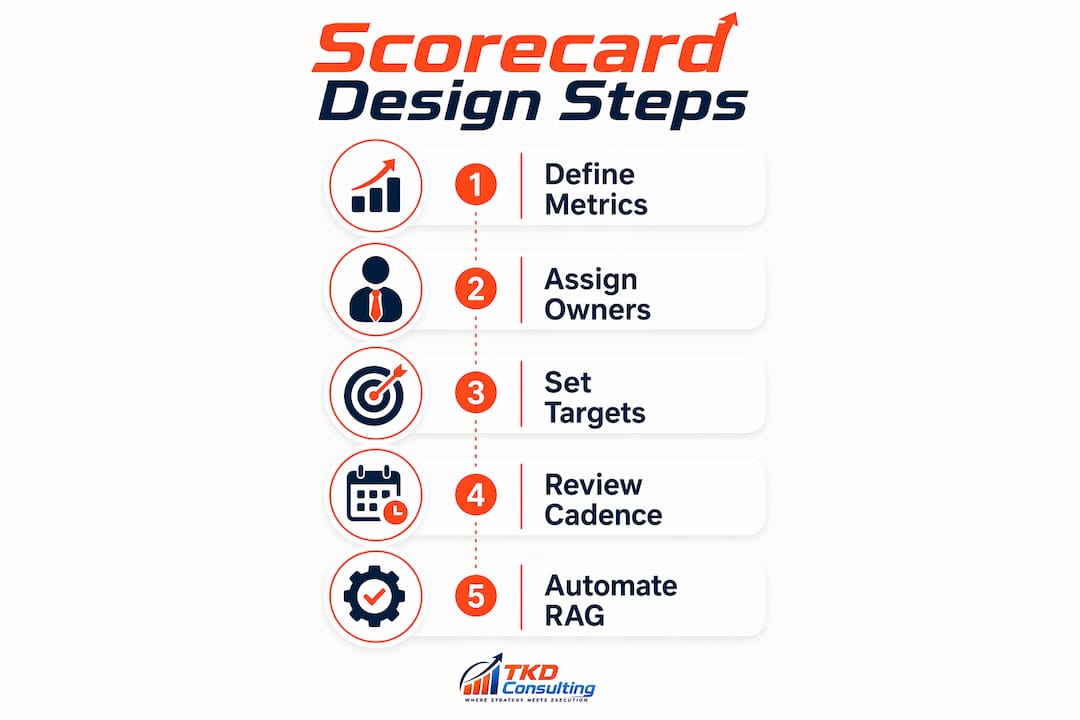
Follow this six-step sequence. Skipping step one is the most common reason scorecards drift into vanity metrics within 90 days.
- Align to strategy. Write the quarter's primary strategic objective in one sentence. Every KPI must connect to it.
- Name the binding constraint. One constraint, not three. The scorecard exists to solve it.
- Shortlist metrics. Generate 15–20 candidates, then cut to 6–18 by asking: can we pull this data this week, and can a manager move it?
- Assign owners and sources. Each metric gets one owner and one named data source. No owner means no accountability.
- Set targets with published logic. Use a combination of external benchmarks and internal trajectory. Define threshold (red), target (yellow), and stretch (green) and publish the reasoning so teams understand what they're aiming for and why.
- Design the layout. One page. Domains in columns or rows, RAG (red/amber/green) color coding, a sparkline or 4-week trend next to each metric, and a dedicated "actions/next steps" box at the bottom.
For each KPI, document: owner, data source, formula, target/thresholds, review cadence, and escalation rule. That definition card lives in a separate tab, not on the scorecard face itself.
Pro Tip: Use conditional formatting in Google Sheets or Excel to automate RAG logic. It takes 20 minutes to set up and removes the manual color-coding step that teams skip under pressure.
What does good scorecard governance actually look like?
Run weekly operational reviews with a fixed agenda and a three-step diagnostic sequence: verify data, evaluate environment, then agree on a recovery plan. That sequence prevents blame and keeps the meeting focused on decisions, not explanations.
Weekly review template (45 minutes):
- Minutes 1–5: Update numbers, confirm RAG status
- Minutes 6–25: Red metrics only — run the diagnostic sequence
- Minutes 26–40: Agree on owners and deadlines for corrective actions
- Minutes 41–45: Preview next week's leading indicators
Match cadence to metric physics: fast-moving operational numbers (throughput, SLA attainment, backlog) get weekly or daily attention. Financial outcomes and people metrics suit monthly or quarterly reviews. Mixing them on the same cadence dilutes both. For operational rhythms that actually stick, the meeting structure matters as much as the metrics themselves.
Two ready-to-use scorecard templates with mock values
Template A: 6-KPI constraint-focused scorecard
| KPI | Owner | Frequency | Target | Green | Yellow | Red |
|---|---|---|---|---|---|---|
| SLA attainment | Ops Director | Weekly | — | ≥— | — | <90% |
| Throughput rate | Plant/Ops Mgr | Weekly | — | — | — | — |
| Gross margin % | Finance | Monthly | — | ≥— | — | — |
| AR aging >60 days | Finance | Weekly | <8% | <8% | 8–12% | >12% |
| Customer churn | CS Lead | Monthly | <2% | <2% | 2–3% | >3% |
| Backlog aging | Ops Director | Weekly | <10 days | <10 | 10–14 | >14 |
Template B: 12-KPI cross-functional steady-state scorecard
| KPI | Domain | Owner | Frequency | Target | Green | Yellow | Red |
|---|---|---|---|---|---|---|---|
| MRR growth | Financial | CFO | Monthly | 8% | ≥8% | 5–7% | <5% |
| Gross margin % | Financial | CFO | Monthly | — | ≥— | — | — |
| AR aging >60 days | Financial | Finance | Weekly | <5% | <5% | — | — |
| NRR | Customer | CS Lead | Monthly | — | ≥— | — | — |
| Churn rate | Customer | CS Lead | Monthly | — | — | — | — |
| NPS | Customer | CS Lead | Quarterly | 45 | ≥45 | 30–44 | <30 |
| SLA attainment | Internal | Ops Director | Weekly | 97% | ≥97% | 93–96% | <93% |
| Deployment freq | Internal | Eng Lead | Weekly | 3/wk | ≥3 | 2 | <2 |
| Incident MTTR | Internal | Eng Lead | Weekly | <4 hrs | <4 | 4–8 | >8 |
| Feature adoption | Internal | Product | Monthly | 60% | ≥60% | 50–59% | <50% |
| Employee NPS | Learning | HR/Ops | Quarterly | 30 | ≥30 | 15–29 | <15 |
| Training completion | Learning | HR/Ops | Monthly | 90% | ≥90% | 80–89% | <80% |
Adapt mock values by replacing targets with your trailing 90-day actuals as the baseline, then set stretch at 10–15% above that. The leading/lagging pair to watch in both templates: SLA attainment (leading signal for customer retention) alongside churn rate (lagging outcome).
What typically breaks scorecards, and how do you prevent it?
The most common failure is too many metrics. Scorecards with 20 or more KPIs produce attention arbitrage: teams optimize the easy-to-move numbers and quietly ignore the hard ones. Successful scorecards cap at 8–18 metrics for exactly this reason.
Rules that keep scorecards disciplined:
- Cap total KPIs at 18; target 8–12 for most mid-market teams
- Pair every lagging outcome with at least one leading indicator
- Lock metric definitions before the first live review — definition drift is how scorecards lose credibility
- Assign a single named owner per metric, never a team
- Keep most metrics payout-free so they stay diagnostic rather than negotiable
Three specific pitfalls: attention arbitrage (too many metrics, so teams cherry-pick), definition drift (the formula changes quietly mid-quarter, making trends meaningless), and wrong cadence (reviewing weekly metrics monthly means you're always reacting, never anticipating). For the cadence problem, the fix is simple: if a metric can't change meaningfully in a week, it doesn't belong on the weekly scorecard. A measurement culture that treats the scorecard as diagnostic rather than punitive is what makes teams report bad numbers honestly.
A practical 60-day rollout plan for owner-operators
A functioning scorecard with coached weekly reviews is achievable in 60 days. Here's the sequence:
- Days 1–7 (Diagnostic): Map current state. Identify the binding constraint. Audit existing data sources for reliability.
- Days 8–14 (KPI Definition): Shortlist 15–20 candidates, cut to 6–12, write definition cards for each. Leadership commits to the constraint.
- Days 15–21 (Prototype): Build the one-page template. Set initial targets from trailing 90-day actuals. Assign owners.
- Days 22–35 (Pilot): Run two live weekly reviews. Identify data gaps and fix them. Adjust thresholds where targets were unrealistic.
- Days 36–49 (Full Launch): Expand to full team. Embed the weekly meeting cadence. Document escalation rules.
- Days 50–60 (Coaching Handoff): Shift facilitation from consultant to internal owner. Review the first month of trend data together and confirm the scorecard is answering the right question.
Leadership decision points: constraint commit (Day 7), investment approval for any data infrastructure (Day 14), and escalation trigger definition (Day 35). The first two quarters should emphasize diagnostic milestones — baselines set, definitions locked, team trained — before shifting to steady-state performance targets.
Pro Tip: Whoever updates the numbers owns the meeting prep. Rotating that responsibility builds capability faster than any training session.
Key Takeaways
A well-designed operations scorecard with 6–18 KPIs, paired leading and lagging indicators, and a weekly review cadence consistently translates strategy into measurable operational results within 60 days.
| Point | Details |
|---|---|
| KPI count matters | Use 6–18 total KPIs (3–5 per domain); 20+ creates attention arbitrage and dilutes focus. |
| Lead with leading indicators | Pair every lagging outcome with a leading indicator so you can intervene before month-end. |
| Cadence drives accountability | Weekly reviews with a fixed agenda and diagnostic sequence outperform quarterly check-ins. |
| Lock definitions first | Metric definitions must be agreed and documented before the first live review to prevent drift. |
| TKD Consulting's approach | The Operations Audit delivers a prioritized 60-day plan with scorecard build, pilot, and coached weekly reviews included. |
Why the one-page constraint matters more than the framework
Most scorecard implementations fail not because the framework is wrong but because the document grows. A VP adds three metrics. Finance wants two more. Within a quarter, the one-page tool is a 24-row spreadsheet nobody reads before the meeting.
The Kaplan and Norton framework is sound. The discipline is in what you refuse to add. Every metric on the scorecard is a claim on attention during the weekly review. Treat it that way. The teams that get the most from their scorecards are the ones that can explain, in one sentence, why each metric is there and what decision it informs.
The other thing most guides miss: the scorecard's job changes over time. In the first two quarters, it should be diagnostic, tracking whether the team has even established reliable baselines. By quarter three, it shifts to performance. By year two, you're pruning metrics that have become stable and adding new ones tied to the next constraint. A scorecard that looks identical in month 24 to month 1 is a sign the business stopped learning, not that it got everything right.
*— David
TKD Consulting's Operations Audit builds your scorecard for you
If you've read this far and your honest reaction is "we don't have the data infrastructure to do this cleanly," that's the most common starting point for TKD Consulting clients.
The Operations Audit is a structured diagnostic that maps your people, processes, and performance systems against your stated goals, then delivers a prioritized 60-day action plan your team can execute starting Monday. Scorecard design, KPI definition, pilot reviews, and coaching handoff are built into the engagement, not sold as add-ons. David Karpatkin works directly with owner-operators and mid-market operations leaders at $5–50M industrial, B2B services, and SaaS companies who need senior operational judgment without adding a full-time executive. The result is a functioning scorecard and a team that knows how to use it, typically within 60 days of kickoff. Book a discovery call at TKD Consulting to see whether the audit fits your situation.
Useful sources and further reading
- The Balanced Scorecard: Measures That Drive Performance — Kaplan & Norton's original HBR article; the foundational text for strategy-linked scorecards.
- What Is a Balanced Scorecard? | HBS Online — accessible overview of the four-domain framework and its modern applications.
- Balanced Scorecard | ASQ — quality-focused definition with domain descriptions; useful for industrial and process-heavy teams.
- Head of Operations Metrics: 18 KPIs | Fairview — best source for KPI count guidance and constraint-driven metric selection.
- KPI Scorecards and Benchmarks | JRG Partners — governance rules, cadence guidance, and the diagnostic sequence for off-target metrics.
- Free Operations Dashboard Template | AppDeck — practical template reference for weekly cadence, rolling averages, and data source setup.
- TKD Consulting Operations Audit — TKD's flagship diagnostic; the 60-day plan and scorecard implementation service described in this article.
- Insights | TKD Consulting — supporting articles on measurement culture, operational rhythms, and execution frameworks.