
Inventory turns (also called the inventory turnover ratio) = COGS ÷ Average Inventory. Average Inventory = (Beginning Inventory + Ending Inventory) ÷ 2. Days Sales of Inventory (DSI) = 365 ÷ Inventory Turns. These three formulas are the foundation of every inventory efficiency diagnosis TKD Consulting runs in an Operations Audit.
- Inventory Turns = Cost of Goods Sold ÷ Average Inventory
- Average Inventory = (Beginning Inventory + Ending Inventory) ÷ 2
- DSI = 365 ÷ Inventory Turns
Turns tell you how many times you sold and replaced your stock in a given period. DSI converts that number into days on hand, which is the figure most operations leaders find easier to act on. A company turning inventory 6 times per year carries roughly 61 days of stock. Cut turns to a lower rate and you're sitting on about three months of inventory — meaning more working capital tied up in a warehouse.
Table of Contents
- What does inventory turnover actually measure for industrial and B2B companies?
- How to calculate inventory turns: a step-by-step worked example
- Common mistakes that make your turns number meaningless
- How to interpret your turns number: benchmarks and context for industrial and B2B
- Practical levers to improve inventory turns, prioritized by impact
- How to monitor inventory turns: KPIs, cadence, and a sample scorecard
- Key Takeaways
- The metric is the easy part
- What an Operations Audit does with your inventory turns data
What does inventory turnover actually measure for industrial and B2B companies?
The inventory turnover ratio measures inventory velocity: how fast you're converting stock into revenue relative to the cost you're carrying. For industrial and B2B operations, that velocity has direct consequences on three things most senior leaders care about.
- Working capital: Slow turns mean cash locked in parts, raw materials, or finished goods instead of funding growth or debt service.
- Service levels: Turns that are too low often signal dead stock crowding out fast-moving SKUs. Turns that are too high can mean you're running lean enough to create stockouts.
- Capacity and lead-time planning: In MRP-driven environments, turns feed directly into reorder points, safety-stock parameters, and supplier cadence decisions.
The metric goes by several names: inventory turns, stock turns, merchandise turnover, and
on the DSI side. They all describe the same underlying relationship between cost flow and stock balance.How to calculate inventory turns: a step-by-step worked example
Start with two numbers from your financial system: COGS for the period and inventory balances on the same cost basis.
Step-by-step:
- Pull COGS from your income statement for the period (monthly, quarterly, or annual).
- Pull beginning and ending inventory from the balance sheet at cost, using the same valuation method (FIFO, LIFO, or weighted average) for both.
- Compute Average Inventory: (Beginning + Ending) ÷ 2.
- Divide COGS by Average Inventory to get turns.
- Divide 365 by turns to get DSI.
Worked example:
| Input | Value |
|---|---|
| Annual COGS | a given amount |
| Beginning Inventory | an initial inventory value |
| Ending Inventory | a closing inventory value |
| Average Inventory | the average of beginning and ending inventory |
| Inventory Turns | calculated accordingly |
| DSI | the result of dividing 365 by turns |

Average Inventory is calculated by averaging the starting and ending inventory. Turns are calculated by dividing COGS by Average Inventory. DSI is calculated by dividing 365 by turns. That's a clean, spreadsheet-ready calculation you can replicate directly from an ERP export.
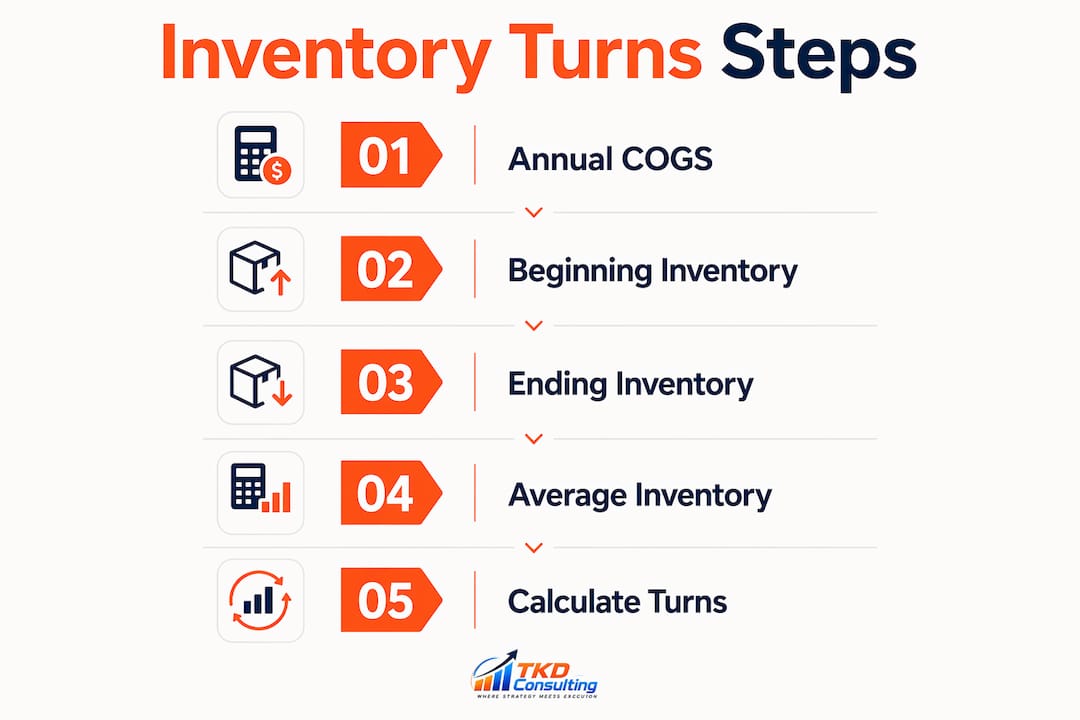
On period selection: annual figures work for strategic benchmarking. For operational decisions, monthly turns catch seasonal shifts faster. If your business has meaningful seasonality, use monthly averages across 12 data points rather than a single beginning-and-ending snapshot.
Common mistakes that make your turns number meaningless
The most frequent error is using Net Sales as the numerator instead of COGS. Analysts consistently recommend COGS because sales include margin markup, which inflates the ratio and hides true velocity. If your inventory is valued at cost and your numerator includes profit, the math is comparing apples to oranges.
Other pitfalls to watch:
- Mismatched cost bases: COGS and average inventory must use the same valuation method. Mixing FIFO-based COGS with a LIFO-based inventory balance produces a ratio that is mathematically invalid.
- Peak-period snapshots: Pulling ending inventory at the close of your busiest quarter will understate turns. A warehouse stocked for a seasonal surge looks artificially lean once you divide into it. Use multi-point averages to smooth this out.
- Phantom stock: Obsolete inventory sitting on the books inflates your average inventory figure and suppresses turns. If you haven't adjusted for slow-moving or reserved stock, your number is flattering you.
- Scope inconsistency: Excluding in-transit or consignment inventory without a documented rule creates period-to-period noise that makes trend analysis unreliable.
- Cross-family comparisons: Comparing turns for capital equipment to turns for consumable fasteners in the same ratio tells you nothing useful. Segment before you benchmark.
How to interpret your turns number: benchmarks and context for industrial and B2B
There is no universal "good" turns number. Industry and product type drive the benchmark more than any general rule. A food distributor running 20+ turns is operating normally. An industrial parts distributor at 4–6 turns may be performing well. A capital equipment dealer at 1–2 turns might be exactly where they should be given 18-month lead times.
The right approach is segmentation, not a single company-wide target.
- Fast-moving consumables (MRO supplies, packaging, common fasteners): set turns targets in the 8–15 range depending on supplier lead time.
- Mid-range replacement parts (motors, pumps, valves): 3–6 turns is typical; adjust for criticality and lead time.
- Slow-moving capital goods or specialty items: 1–2 turns may be intentional if the cost of a stockout (lost production, emergency freight) exceeds the carrying cost.
When high turns are a warning sign: if turns are climbing but fill rate is dropping and expedited freight costs are rising, you've crossed from efficient into dangerously lean. Pairing turns with fill rate and expedited freight cost is the only way to catch that trade-off before it hits a customer.
When low turns are deliberate: strategic buffer stocking ahead of a known supply disruption, a long-lead-time component, or a contract requiring guaranteed availability are all legitimate reasons to carry more days on hand than a benchmark would suggest.
Pro Tip: Never optimize turns in isolation. Track DSI, fill rate, backorder rate, and expedited freight cost together. A turns improvement that costs you 5 percentage points of fill rate is not a win.
Practical levers to improve inventory turns, prioritized by impact
The fastest path to better turns is reducing days on hand without increasing service risk. Start with the levers that require no capital investment and no supplier negotiation.
High-priority (30–60 days):
- SKU rationalization: Identify the bottom 20% of SKUs by velocity and gross margin. Discontinue, consolidate, or shift to make-to-order. Dead SKUs inflate average inventory and consume pick locations.
- Order-minimum and lot-size optimization: Oversized purchase minimums force excess stock. Renegotiate minimums or shift to more frequent, smaller orders where freight economics allow.
- Safety-stock recalibration: Most safety-stock parameters in ERP systems are set once and never revisited. Recalculate using current lead-time variability and demand variability data.
- Demand signal improvements: Integrate sales pipeline data and customer forecast commitments into replenishment logic. Even rough 30-day forward visibility reduces reactive over-ordering.
Medium-priority (60–120 days):
- Vendor-managed inventory (VMI) programs for high-velocity, low-complexity items shift the carrying burden to the supplier.
- Consignment arrangements for specialty or high-value components reduce your balance-sheet exposure.
- Cycle-count discipline to eliminate phantom stock: if your system shows 200 units but the shelf holds 140, your turns calculation is wrong before you even start.
Longer-horizon levers (manufacturing lead-time reduction, network redesign, design-for-manufacturability changes) deliver larger structural improvements but require capital, cross-functional alignment, and 6–18 months of runway. Pair each lever with a measurable KPI, a named owner, and a 60-day pilot before scaling. That sequencing is exactly how TKD Consulting structures the Operations Audit action plan. For operations with distributed stock, tracking inventory across fulfillment centers adds another layer of complexity that requires its own data discipline before turns calculations are reliable.
How to monitor inventory turns: KPIs, cadence, and a sample scorecard
Monitor turns alongside DSI, fill rate, backorder rate, and expedited freight cost. Those five metrics together tell the full story; turns alone tells only part of it. Building measurement culture around this set is what separates teams that improve from teams that just report.
Recommended cadence:
- Weekly: exception-based review of DSI by SKU cohort, backorder flags, and expedited freight triggers.
- Monthly: full turns reconciliation against COGS and average inventory; fill rate and backorder rate review with owners.
- Quarterly: benchmark refresh, target reset by cohort, and scorecard audit.
Sample scorecard:
| Period | COGS | Avg Inventory | Turns | DSI | Fill Rate | Backorder Rate | Exp. Freight Cost | Owner | Trend |
|---|---|---|---|---|---|---|---|---|---|
| Q1 | — | — | 6 | 61 days | — | — | — | Ops Director | ↑ |
Flag any period where turns improve but fill rate drops more than 1 percentage point or expedited freight rises more than 10%. That combination signals the turns gain came at a service cost. Embed this scorecard in your operational rhythms so it surfaces in the right meeting, with the right owner, every month.
Key Takeaways
The inventory turns formula (COGS ÷ Average Inventory) is only useful when paired with DSI, fill rate, and expedited freight cost — the ratio alone cannot tell you whether your inventory position is healthy.
| Point | Details |
|---|---|
| Core formula | Inventory Turns = COGS ÷ Average Inventory; DSI = 365 ÷ Turns. |
| Always use COGS | Net Sales inflates the ratio; COGS and inventory must share the same valuation method. |
| Segment before benchmarking | Set separate turns targets for consumables, replacement parts, and capital goods. |
| Pair with service metrics | A turns gain that raises expedited freight or drops fill rate is not an improvement. |
| TKD Consulting Operations Audit | Diagnoses turns drivers, delivers a prioritized 60-day action plan, and embeds scorecards for sustained execution. |
The metric is the easy part
Most operations teams can calculate inventory turns in an afternoon once they have a clean COGS export and consistent inventory balances. The harder problem is knowing which number to trust, which SKU cohort to fix first, and what to do Monday morning when the ratio says you're carrying 30 extra days of stock.
The teams that improve turns sustainably are not the ones who found the formula. They're the ones who built a cadence around it, assigned ownership, and ran disciplined pilots before scaling changes across the full SKU base. The formula is a diagnostic tool. What you do with the diagnosis is the actual work.
A single turns ratio that looks healthy at the company level can mask a fast-moving consumables segment running at 2 turns while a slow-moving capital goods segment runs at 12. Aggregate numbers hide the real problem. Segment first, then act.
What an Operations Audit does with your inventory turns data
Knowing your turns number is the starting point. Knowing which levers to pull, in which order, with which owners accountable, is where most operations leaders get stuck. TKD Consulting's Operations Audit is built for exactly that gap: a structured diagnostic that maps your inventory position, identifies the highest-impact turns drivers, and delivers a prioritized 60-day action plan your team can execute without a consultant in the room.

The engagement includes the scorecard templates, meeting cadences, and accountability frameworks described in this article, so the improvements don't evaporate after the diagnostic ends. No slide deck, no 200-page report. A plan your floor manager can act on by next Monday. If your turns number is telling you something is wrong and you're not sure where to start, book a discovery call and we'll show you exactly where to look.